Sequence learning for classification
This is a POC (proof of concept) which is meant to test the feasibility of sequence approach in solving classification problems with grocery data.
If proven, the approach could resolve a few issues with my ML modeling workflow:
- The series of items consumed by an user is a type of data that is often hard mine due to the large number of different items and the lack of meta data come with each item.
- Models that leverage these types of data usually need to go through extensive feature engineering processes which could be time consuming, which mean slow time to production.
- In addition, the features engineered for one model are usally very specific for that problem alone and have little use for other problems. In other words, they have low reusability.
The sequence approach could protentially solve the issues above by:
- Understanding each item through the mean of item embedding and transfer learning, thus increase reusability.
- Eliminate the need for feature engineering, thus decrease time to produciton.
Problem framing
The dataset
The dataset used in this POC is from Instacart, described in the company’s blog post here. Overall, there are 3.4 million transactions, in which total of ~50,000 unique products was purchased by 206,000 unique users. In addition to transactional data, metadata about each products also provided including product departments (product category) and product aisle (sub-category). Below are some visulization of the datasets:
Classification problem
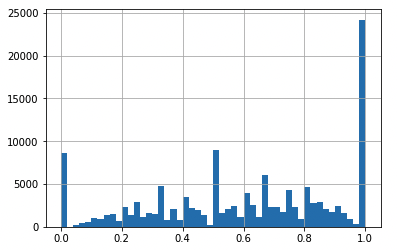
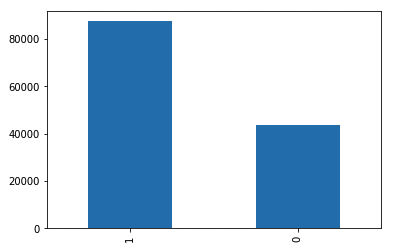
Since the dataset is not itself a classification problem, I have to make up one myself. Let’s predict whether or not the next order will have equal or more than 50% re-purchase products or not. This is a good way to represent the problem since a good model should understand well the nature of each product and also harness that information to predict the percentage of re-purchase products. Below are the visualization of percentage of re-purchase distribution, in original and binary form.


Modeling
For the POC, I employed a two-stages approach to the modeling process.
First, create embedding for each product_id by using a word2vec model, which consider each product as a word and each order as a sentence. The word2vec model use Continuous bag of words (CBOW) architecture to create embedding vectors for each word.
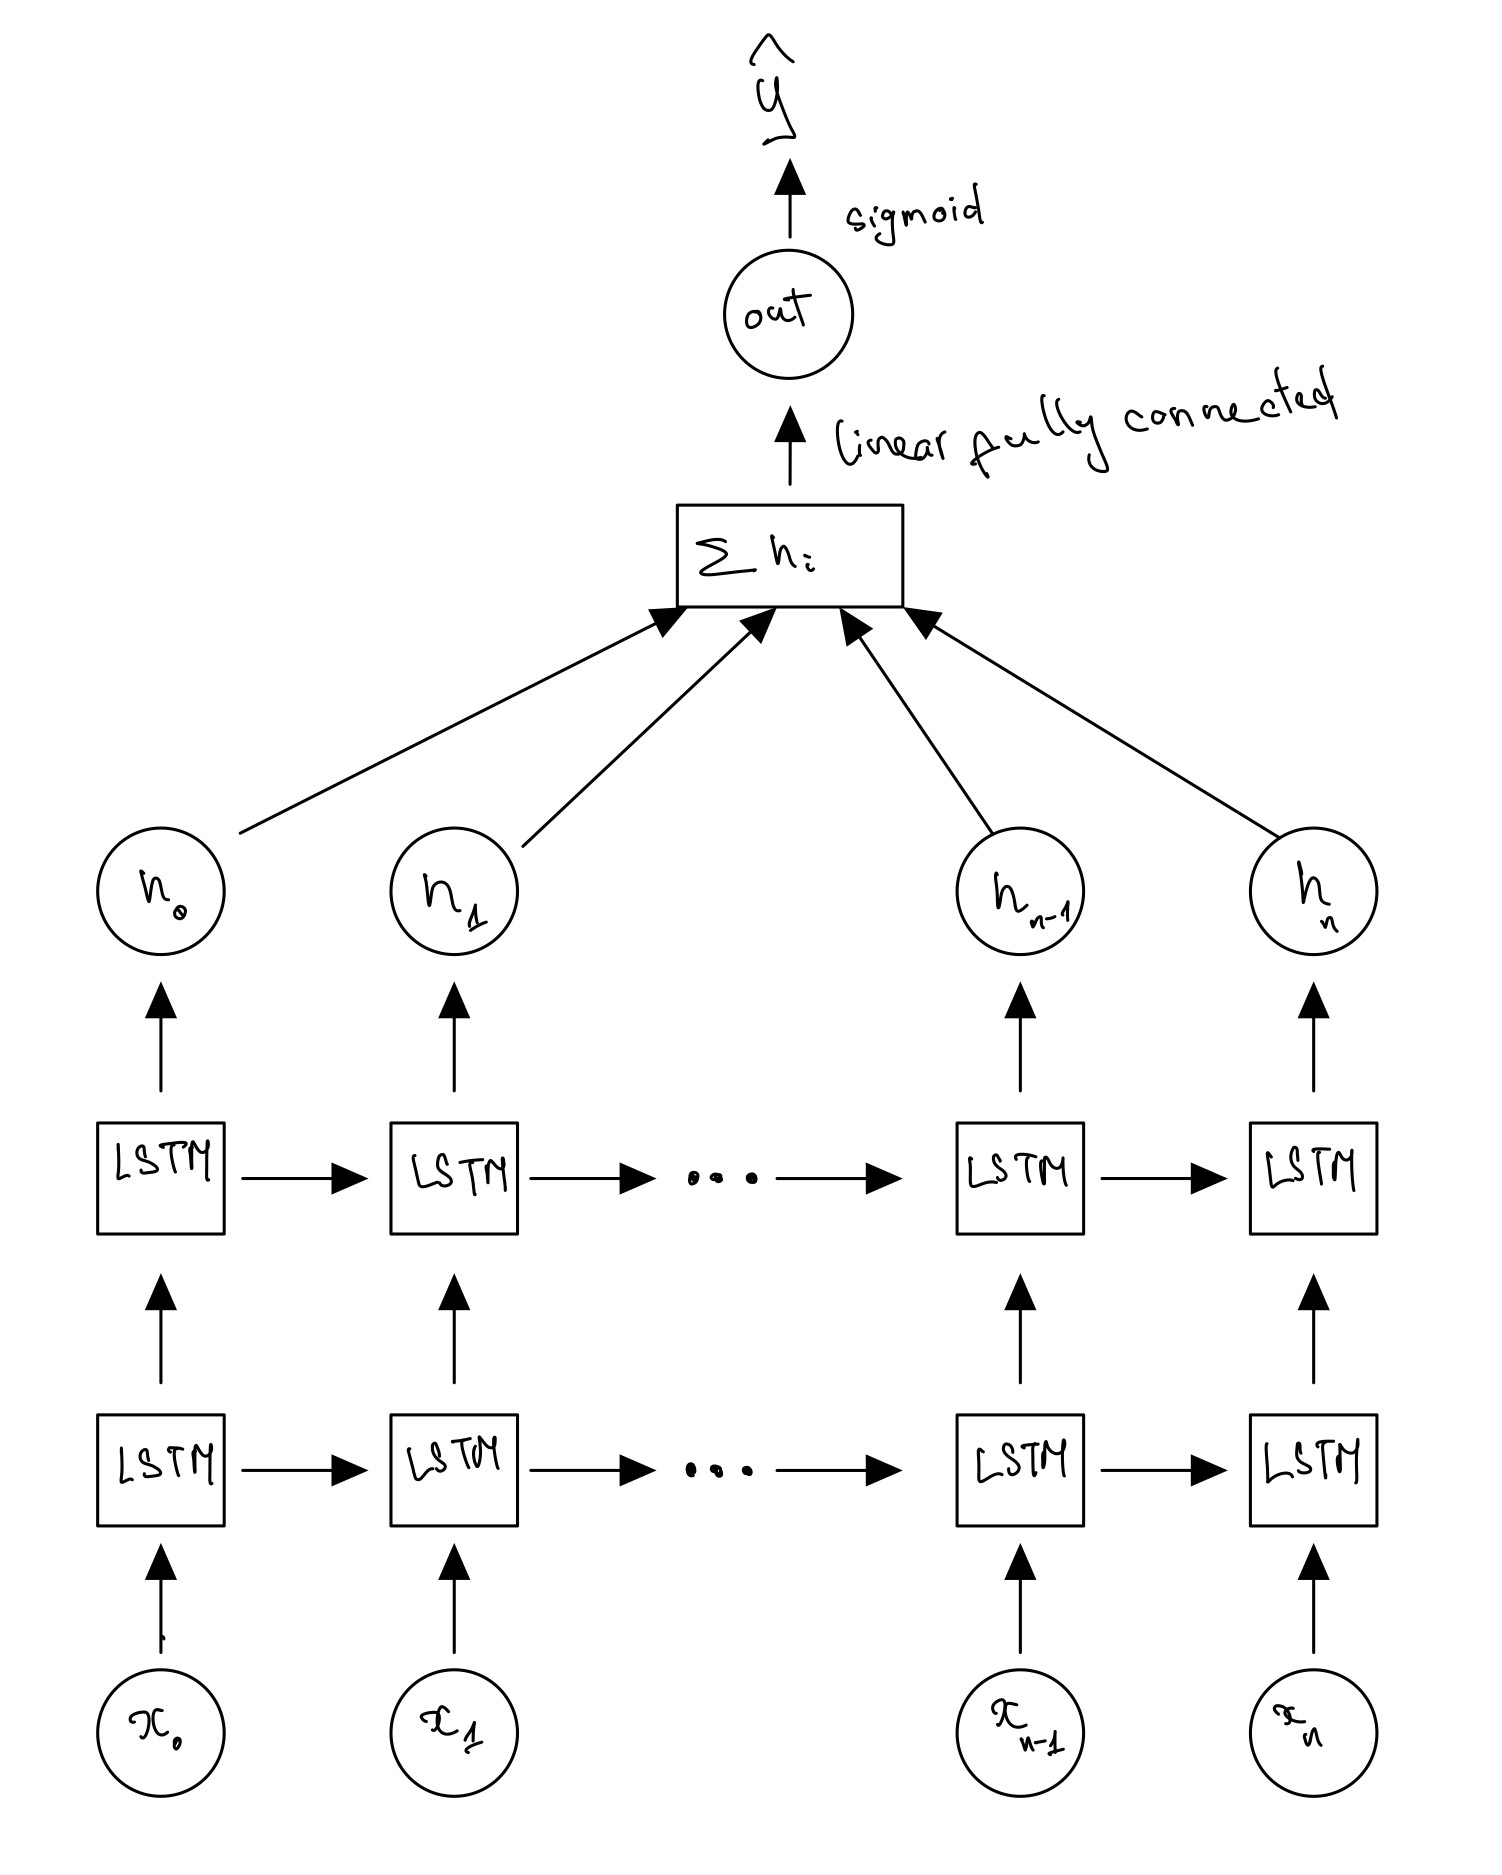
Secondly, a recurrent neural network with 2 LSTM layers is employed for classification task. The structure of the neural network is described in the graph below:

Results
Since the modeling has two distinctive part, let’s discuss the results with the same manner.
First, let’s talk about embedding model. Since this is unsupervised learning, I do not deepdive too much on the metrics. Instead, I randomly select a product and find the most similar products in terms of cosine distance between the represetations. Then, I can eye-balling the results to see whether or not those products are indeed similar to eachother. The results are pretty good. Considering the model did not receive any text description data, it is amazing to see it can group organic products together, products with the same or similar functions together. Let’s take a look at some of the results:
Products that are similar to ['Organic Strawberries']:
                                        product_name  similarity
0                      Organic Green Seedless Grapes    0.682290
1                              Organic Bartlett Pear    0.610151
2                              Organic D'Anjou Pears    0.585057
3                             Organic Yellow Peaches    0.570408
4                        Organic Whole String Cheese    0.561329
5                                  Organic Nectarine    0.560614
6  Organic Yokids Lemonade/Blueberry Variety Pack...    0.544303
7                                       Organic Kiwi    0.534063
8                                 Organic AppleApple    0.532100
9  Aged White Cheddar Baked Rice & Corn Puffs Glu...    0.520892
==========================================================================================
Products that are similar to ['Organic Whole Milk']:
                      product_name  similarity
0         Organic Reduced Fat Milk    0.718352
1          Whole Milk Plain Yogurt    0.644424
2           Organic Lowfat 1% Milk    0.644031
3      Organic Whole String Cheese    0.613026
4      Medium Cheddar Cheese Block    0.533556
5        Organic Blueberry Waffles    0.529626
6        Organic Homestyle Waffles    0.513630
7       Whole Organic Omega 3 Milk    0.494347
8       Organic Multigrain Waffles    0.492504
9  Organic Lactose Free Whole Milk    0.489613
==========================================================================================
Products that are similar to ['Organic Yellow Onion']:
                           product_name  similarity
0                  Organic White Onions    0.780003
1                    Organic Beef Broth    0.652083
2                        Organic Garlic    0.649497
3                Organic Diced Tomatoes    0.631791
4                  Organic Tomato Paste    0.626498
5  Organic No Salt Added Diced Tomatoes    0.625215
6                 Organic Russet Potato    0.622263
7                    Organic Red Potato    0.599936
8                 Organic Chicken Stock    0.589403
9                  Organic Tomato Sauce    0.574827
==========================================================================================
Products that are similar to ['Sea Salt & Vinegar Potato Chips']:
                                        product_name  similarity
0                     Backyard Barbeque Potato Chips    0.778691
1                           Honey Dijon Potato Chips    0.709262
2                        Salt & Pepper Krinkle Chips    0.708415
3                              Jalapeno Potato Chips    0.660444
4                              Sea Salt Potato Chips    0.654459
5          Krinkle Cut Classic Barbecue Potato Chips    0.631537
6                    Sour Cream & Onion Potato Chips    0.612455
7                  Krinkle Cut Sea Salt Potato Chips    0.610915
8  Krinkle Cut Salt & Fresh Ground Pepper Potato ...    0.607179
9                              Barbeque Potato Chips    0.540908
==========================================================================================
Products that are similar to ['Cereal']:
                                        product_name  similarity
0                Frosted Mini-Wheats Original Cereal    0.642193
1                     Apple Cinnamon Cheerios Cereal    0.603689
2                        Quaker Life Cinnamon Cereal    0.597323
3                          Raisin Bran Crunch Cereal    0.585626
4                        Oatmeal Squares Brown Sugar    0.565763
5                                        Reese Puffs    0.564926
6                                Lucky Charms Cereal    0.564270
7                                 Honey Nut Cheerios    0.561625
8  Honey Bunches of Oats Honey Roasted with Almon...    0.549325
9                               Rice Krispies Cereal    0.548181
==========================================================================================
The fact that cosine similarity can identify the relationship between these products means the embedding vectors did a good job of encoding information about each product only by taking a look at how were they bought together.
Second, the classification model. Below are the classification report of the model on the validation set:
              precision    recall  f1-score   support

           0       0.62      0.40      0.48      4409
           1       0.74      0.87      0.80      8712

    accuracy                           0.71     13121
   macro avg       0.68      0.64      0.64     13121
weighted avg       0.70      0.71      0.70     13121
Since we care mostly about the customers that has more re-purchased products in their next order, metrics for class 1 - the positive class is the main focus. We can see that the model achieve precision of 0.74, recall of 0.87 and f1-score of 0.80 -> quite good performance for a POC.
Conclusion and Future work
Overall, the results demonstrated that applying a sequence approach to mine grocery purchases does solve the issues mentioned in the first paragraph. The models not only able to extract useful information about the products using only transactional data, but also able to use those information to effectively predict future buying behavior of the customer. Based on this result, one can confidently apply the two-step approach to build prediction models for various different task, especially when the embedding can be re-used easily.
For future work, when I have more time, I would like to explore ways to integrate information about product price as well as the frequency and recency of the orders to the classification model to improve the classification performance.
Reference
“The Instacart Online Grocery Shopping Dataset 2017”, Accessed from https://www.instacart.com/datasets/grocery-shopping-2017 on 2018-03-24.
